Lectures:
In this page we'll post useful information about the lectures: source codes,
data, references, etc...
Index:
Software/Goodies:
- A practical introduction to Matlab (HTML, PDF)
- Matlab Help
- my_defaults.m (nice Matlab defaults)
- Matlab GUI for differential equations: Phase Plane and Slope Field.
If you would like to draw on top of the phase plane manually
use the following commands:
-
which PhasePlane % Where PhasePlane is located. Use it in the next line.
-
pathpp='C:\Users\rcarretero\AppData\Roaming\MathWorks\MATLAB Add-Ons\Apps\PhasePlane'; % Store path where PhasePlane resides [use the directory from previous line]
-
pathpp='/home/carretero/MATLAB Add-Ons/Apps/PhasePlane'; % Ubuntu directory where PhasePlane resides
-
path(path,pathpp); % Add PhasePlane directory to path
-
hh=PhasePlane; % Start PhasePlane and store its handle
-
pp=hh.UIAxes_pp; % Extract the handle to the phase plane panel
-
hold(pp,"on") % Ask to plot on top without erasing previous
-
plot(pp,0,0,'*') % Plot whatever you want
You can also plot on top of the x and y axis using their respective handles:
-
px=hh.UIAxes_x; % Extract the handle to the x-axis
-
py=hh.UIAxes_y; % Extract the handle to the y-axis
You can also extract data from PhasePlane and plot it in another figure:
-
pg=pp.Children; % Extract the handle to graphs
-
x1=pg(end-1).XData; % Extract x-data of last curve plotted in pp
-
y1=pg(end-1).YData; % Extract y-data of last curve plotted in pp
-
figure;plot(x1,y1); % Plot data in a different figure
- XXP/AUTO: webpage/dowload,
tutorial,
sample ode files.
Intro:
One-dimensional flows:
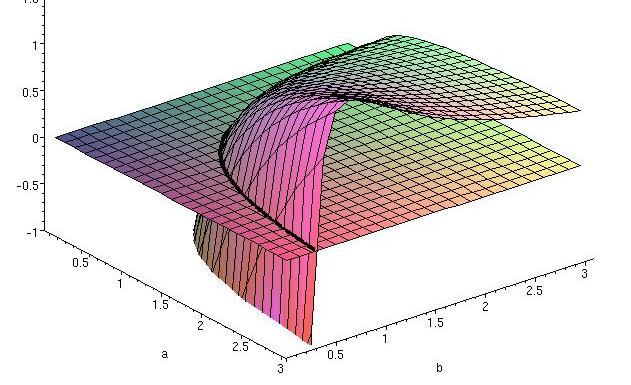
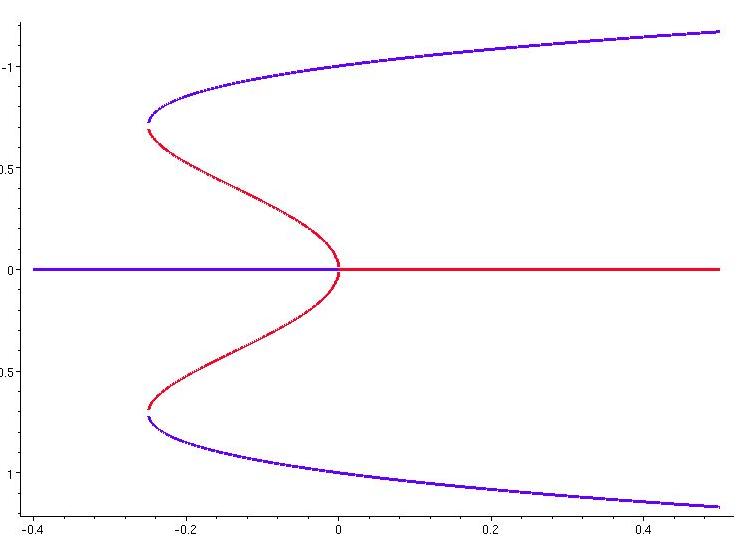
Bifurcations:
Two-dimensional flows:
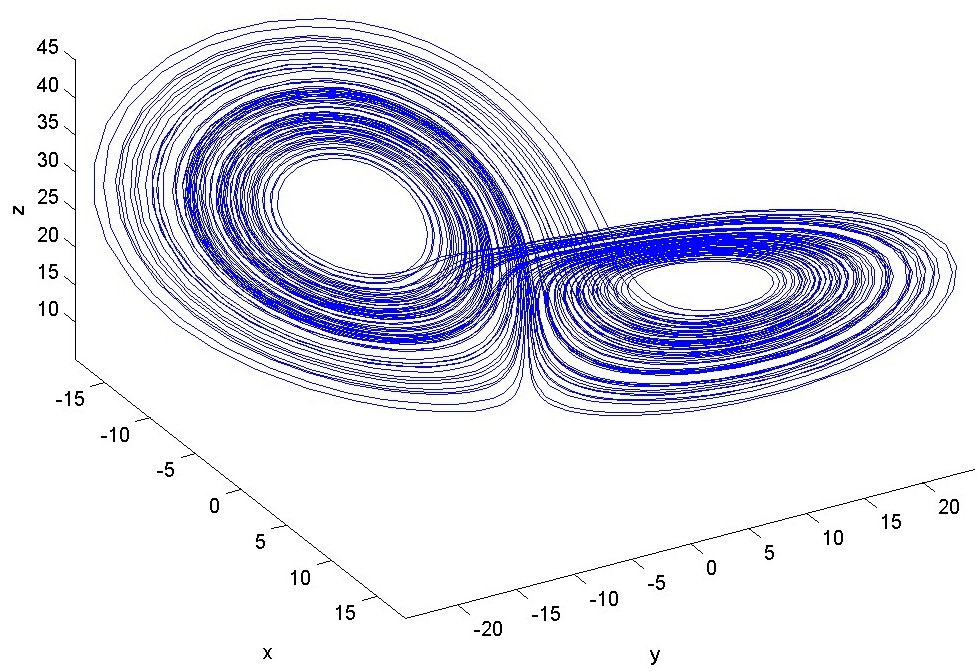
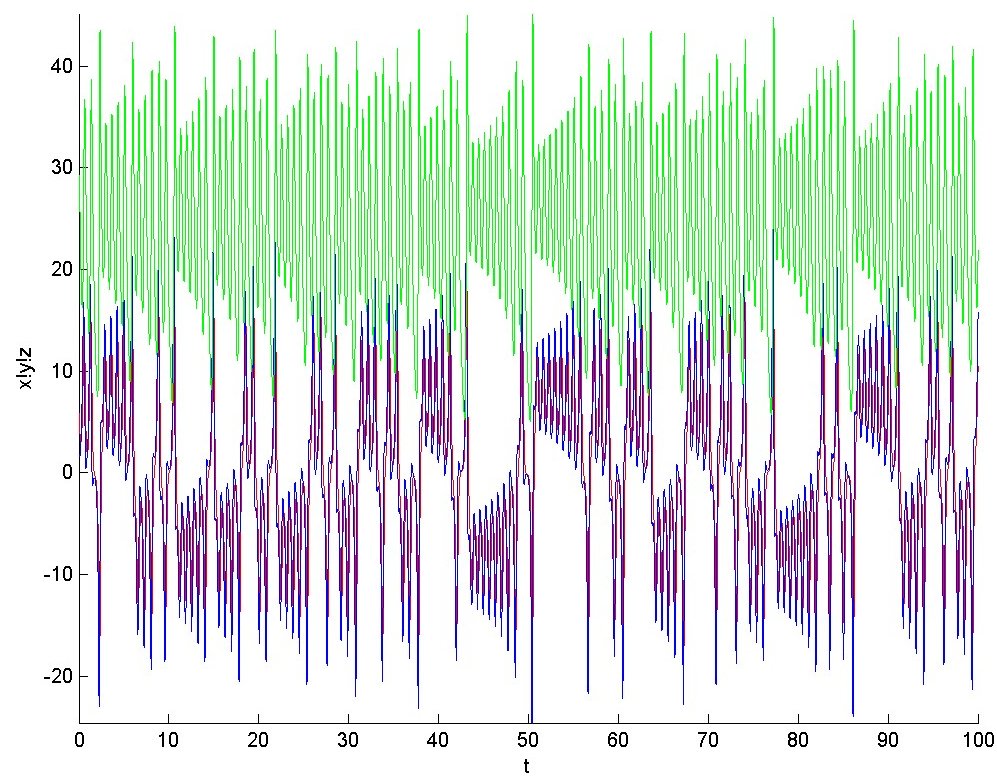
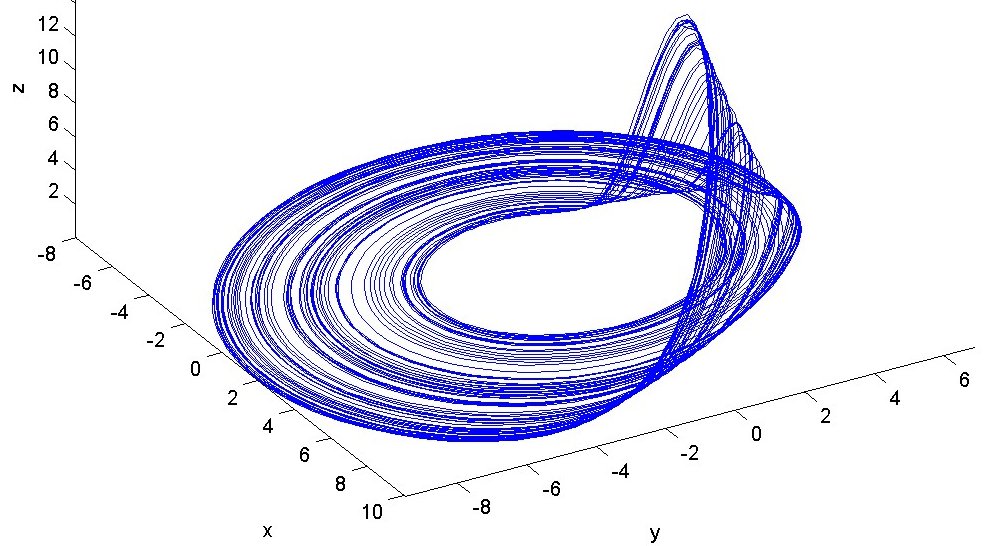
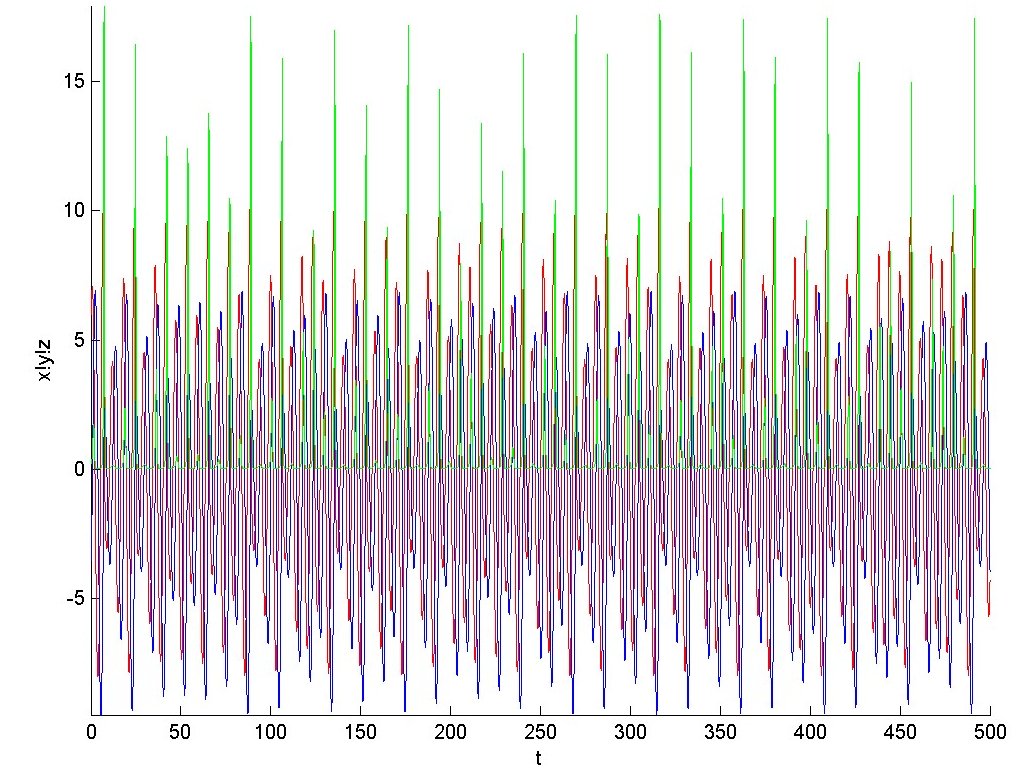
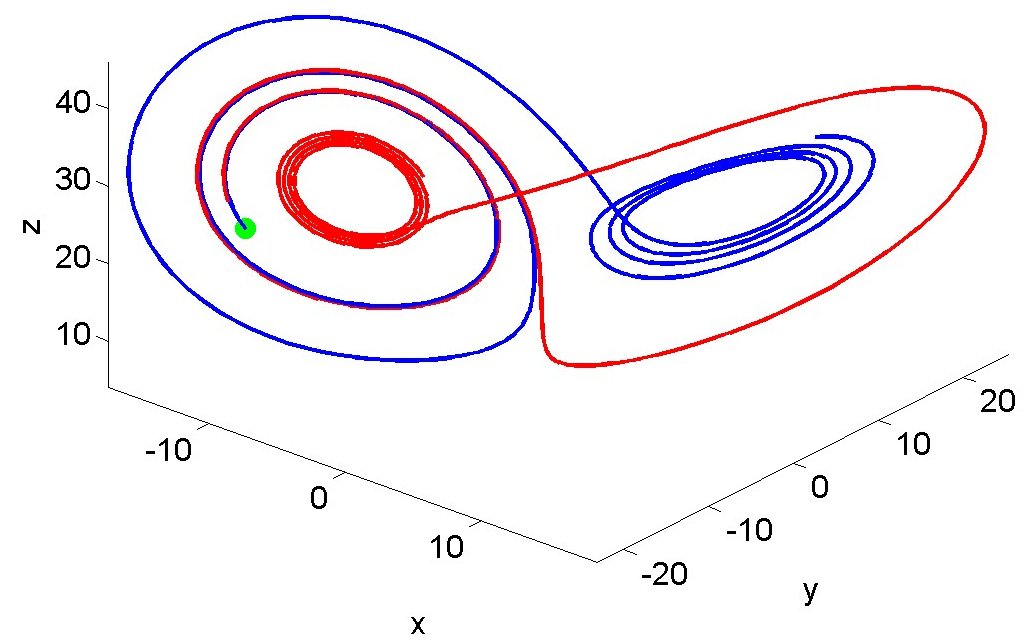
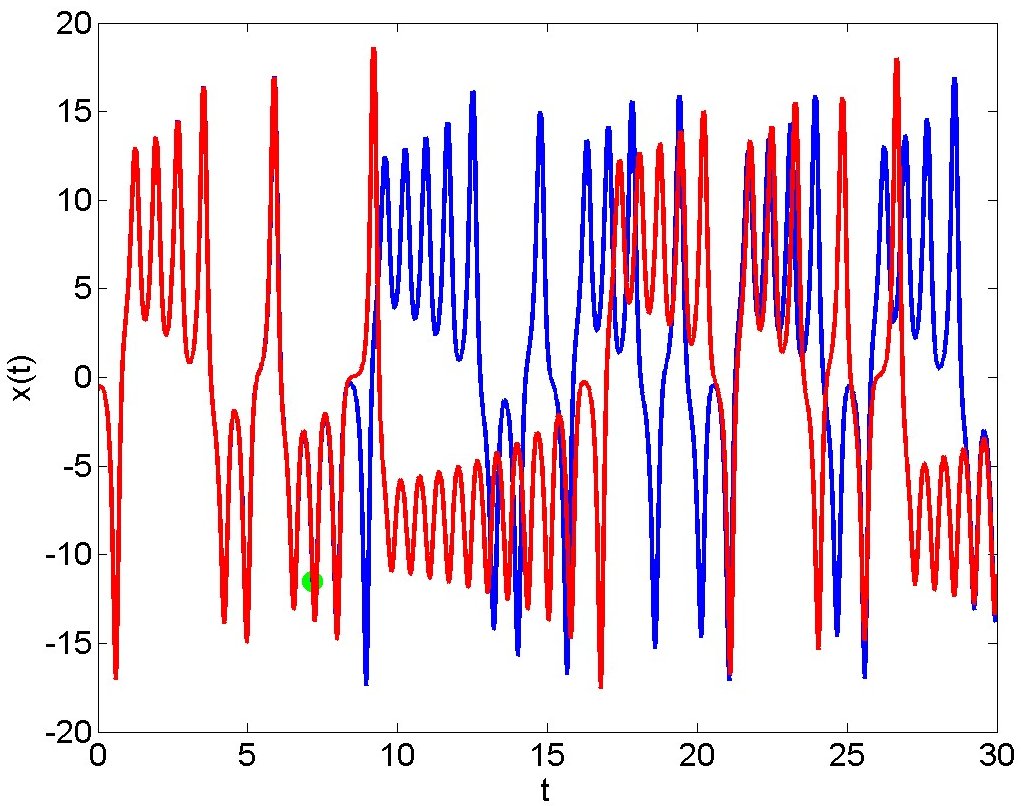
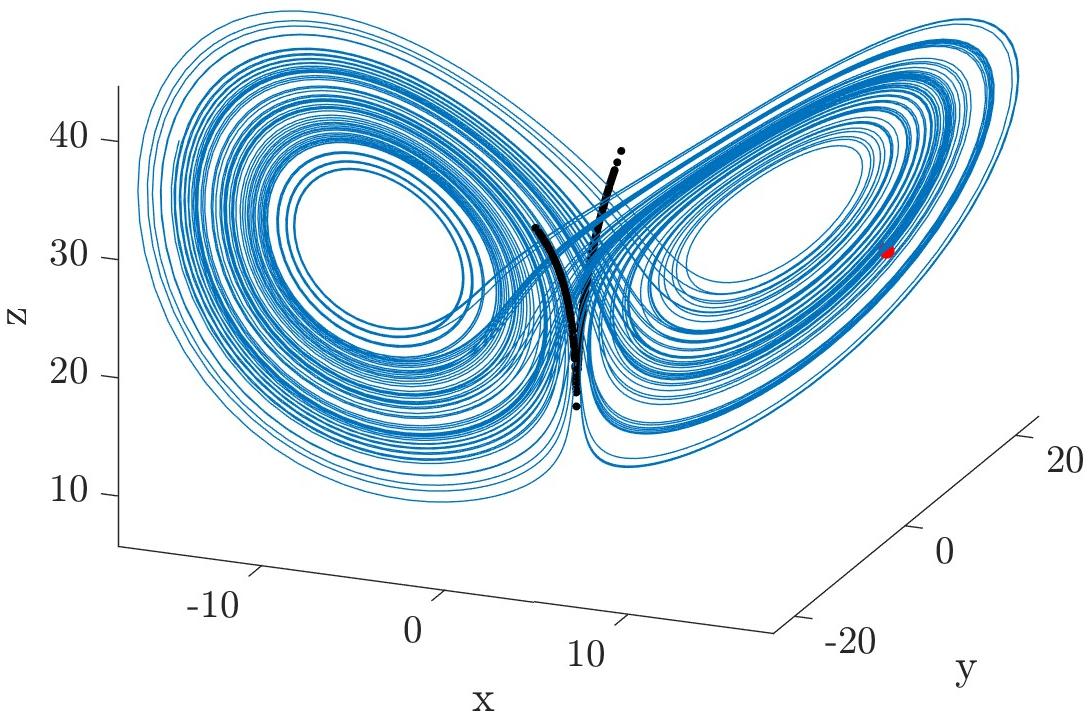
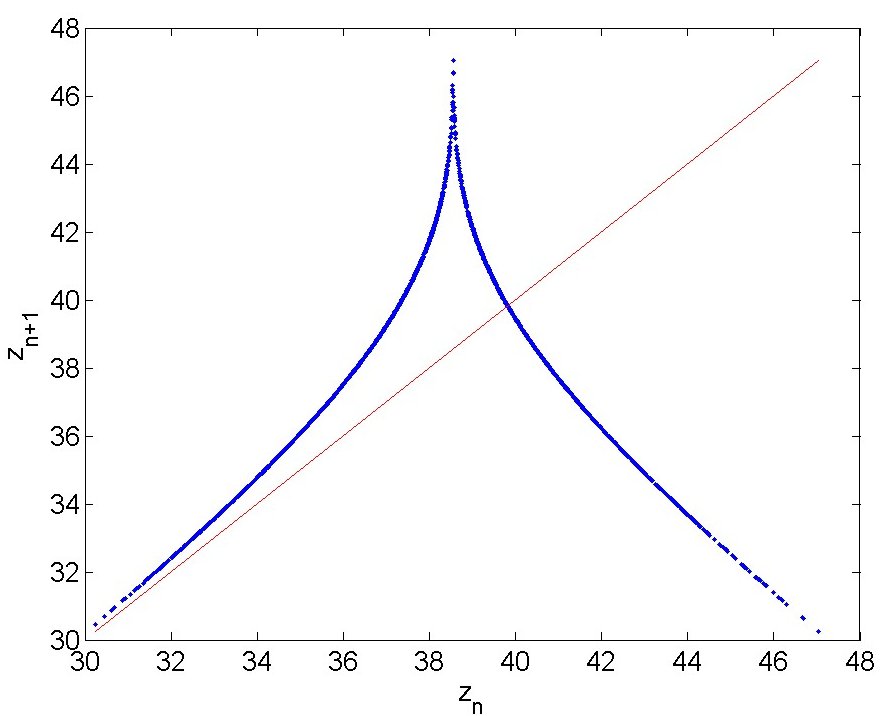
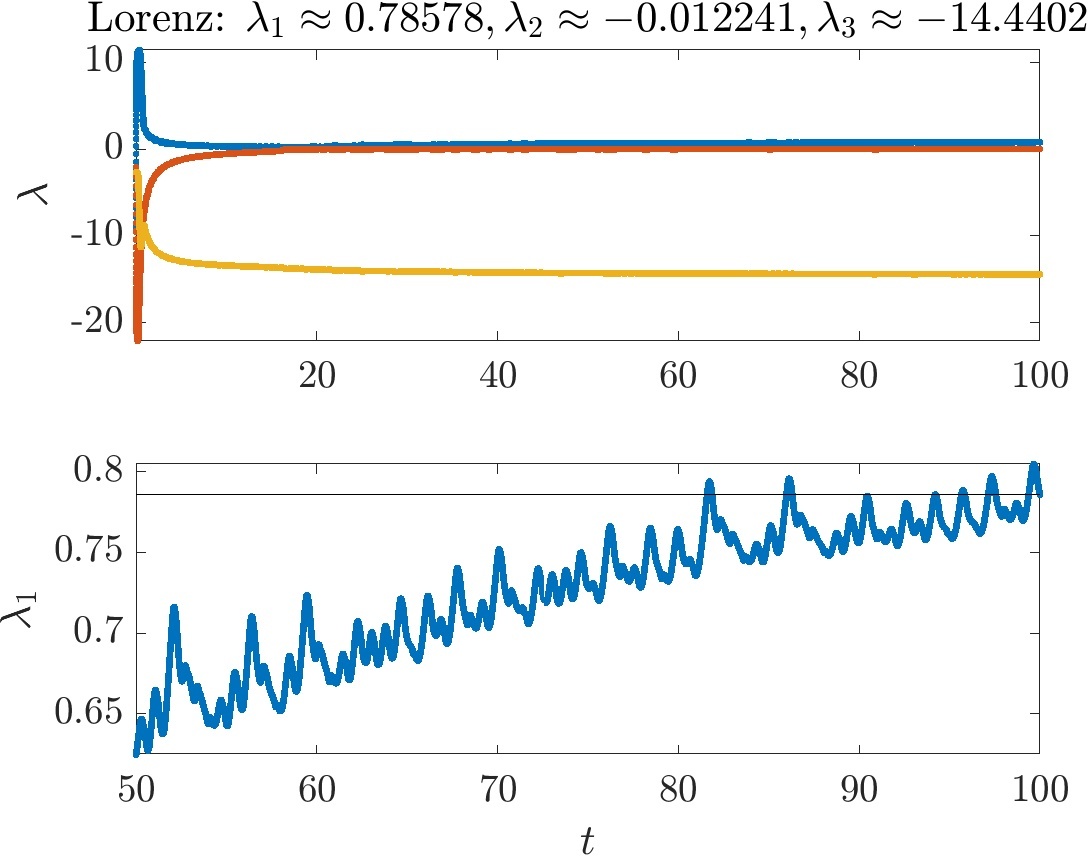
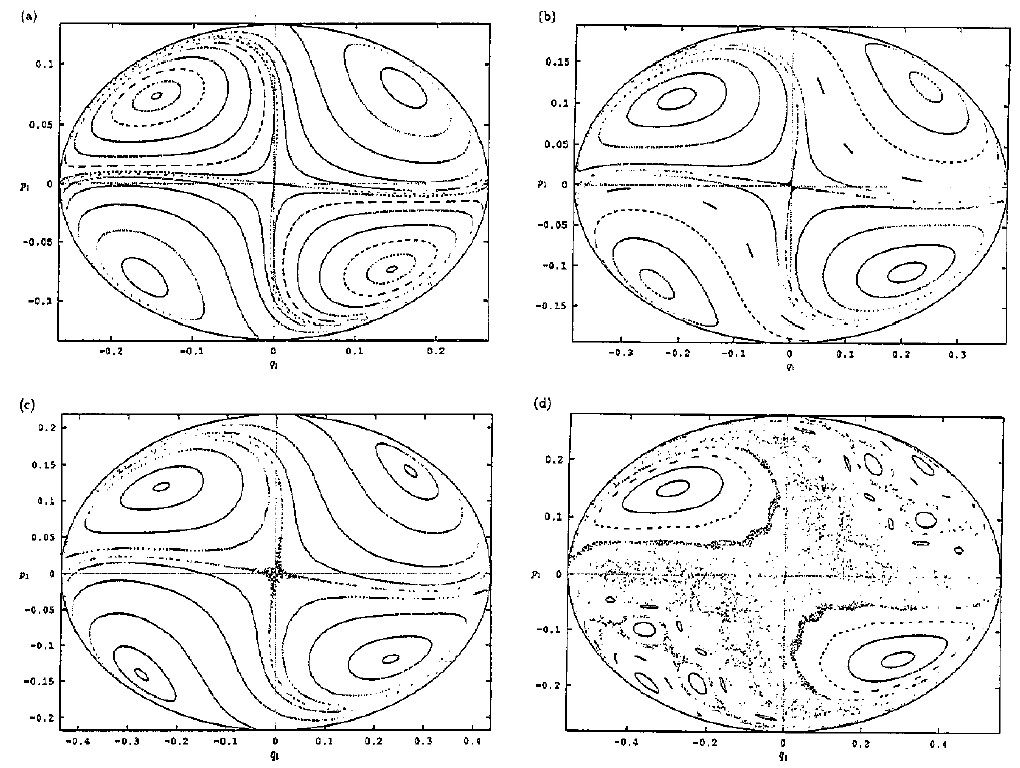
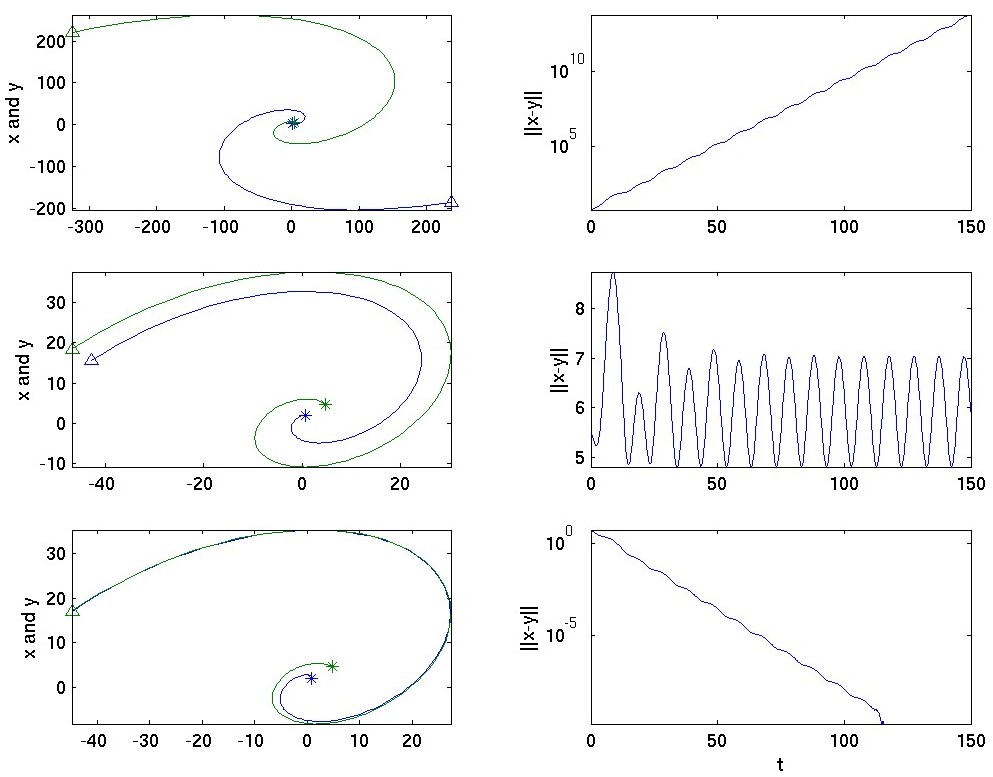
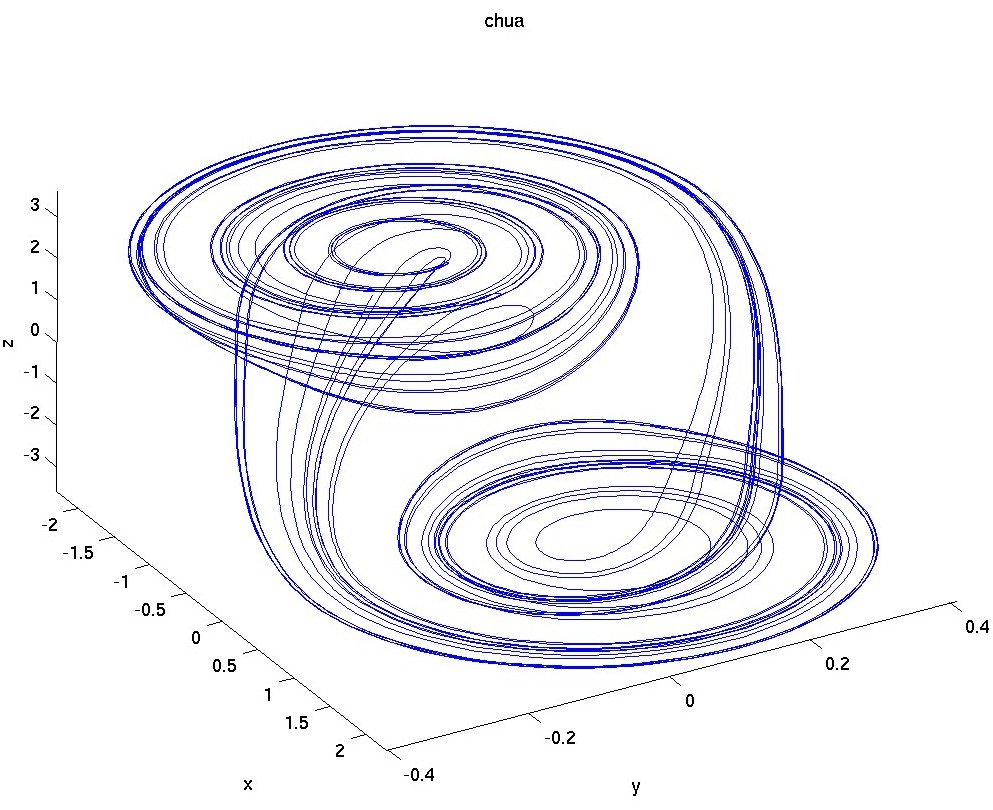
Chaos:
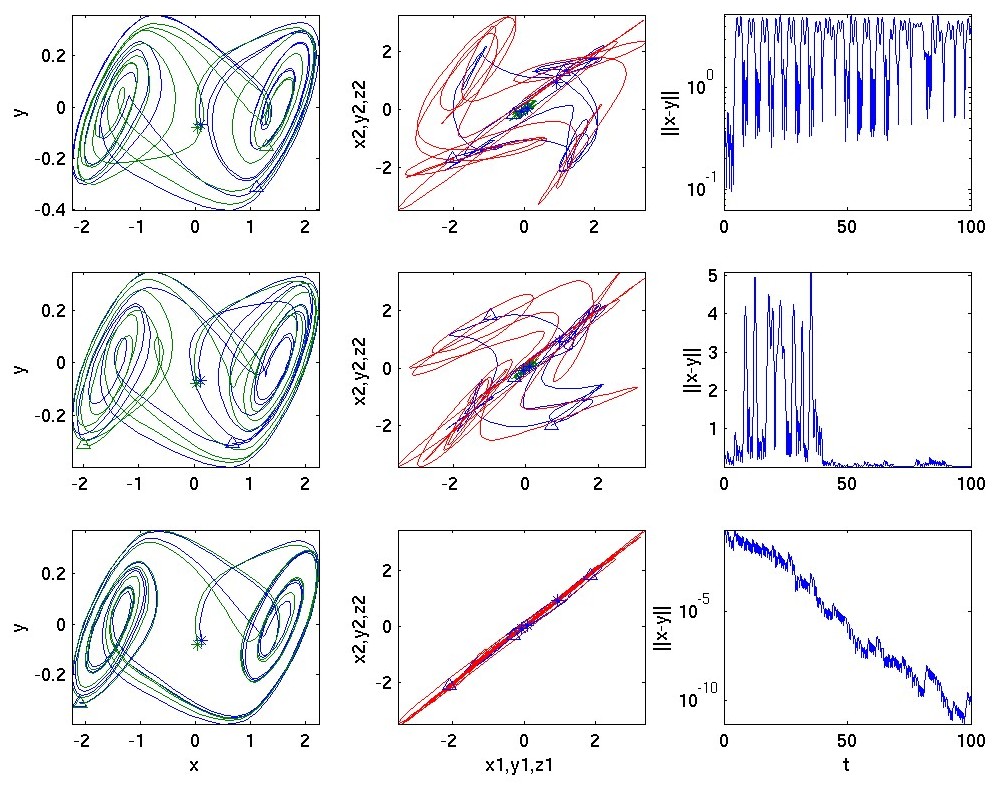
Synchronization: